The Hump and The WallThe other sections of this website deal with ways to fix the current system so it will be there for the younger generations. What about those generations who are already on or are close to starting Social Security? This section is going to talk about how the current tax laws can impact your retirement plans. Some of the topics will sound a bit farfetched, but they are accurate and we will provide you with step by step TaxCaster examples. TurboTax TaxCaster is a great tool for estimating your taxes. Make it a yearly event to run this program the Friday after Thanksgiving. That will give you enough time to make any yearend adjustments that might be necessary to minimize your tax burden. Our links to TurboTax will pop up TaxCaster in a separate window. As you read our examples, feel free to switch between windows and make the entries yourself. Your results will be the same:
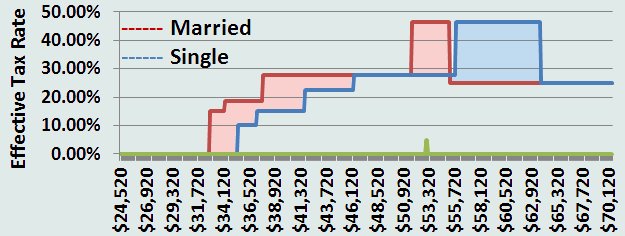
I know those two statement sound ridiculous, but read on and run our TaxCaster examples for yourself. Both statements are absolutely true! The HumpWho pays the highest marginal income tax rate?Is it the quarterback for your favorite NFL team? No, his top rate is only 35%. Would you believe a married couple each earning $65,000?Would you believe a single person earning $75,000?Based on the 2011 tax laws, the following chart illustrates the effective tax rates paid by 3 individuals, each earned $65,000 while working and each receives $24,520 in Social Security Benefits during retirement. As their additional income from pensions and IRAs increases, their tax rates also increase. The married couple enters the 46.25% tax bracket when each of their retirement incomes reaches $51,820 while the single individual doesnít reach that tax bracket until their income reaches $55,920.
When you are in "The Hump", an additional $100 withdrawn from your IRA results in an additional $85 of your Social Security benefit becoming taxable. You then pay 25% of the $185, or $46.25, in additional taxes for each $100 you withdraw. The red area of this chart illustrates the Marriage Penalty where a married couple pays higher taxes at lower income levels. The blue area shows where single individuals eventually pays a higher tax rate. When everyoneís income reaches the $63,720 level, the blue area equals the size of the red area and everyone has paid the same amount of taxes. Basically, the tax laws are designed to penalize lower income married couples! They say a picture is worth a thousand words, so we created a TaxCaster example that illustrates the 46.25% tax bracket. The Wall is Even WorseAs if the hump's effective tax rate of 46.25% wasn't bad enough;
|
|||||||||||||||||||||||||||||||||||||||||||||||||||||||||||||||||||||||||||||||||||||||||||||||||||
| Line | Earned Income |
SS Benefit |
85% of Benefit |
Taxability Basis |
Taxable SS |
Taxable Income |
Taxes Due |
After Tax |
-OASDI -Medi |
Effective Tax Rate |
| 1 | $100.00 | $0.00 | $0.00 | $100.00 | $85.00 | $185.00 | $27.7500 | $72.2500 | $64.6000 | 35.4000% |
| 2 | $100.00 | -$50.00 | -$42.50 | $75.00 | $63.75 | $163.75 | $24.5625 | $25.4375 | $17.7875 | 82.2125% |
| 3 | $100.00 | -$50.00 | -$42.50 | $75.00 | $63.75 | $163.75 | $40.9375 | $9.0625 | $1.4125 | 98.5875% |
| 4 | $100.00 | -$50.00 | -$42.50 | $75.00 | -$42.50 | $57.50 | $14.3750 | $35.6250 | $27.9750 | 72.0250% |
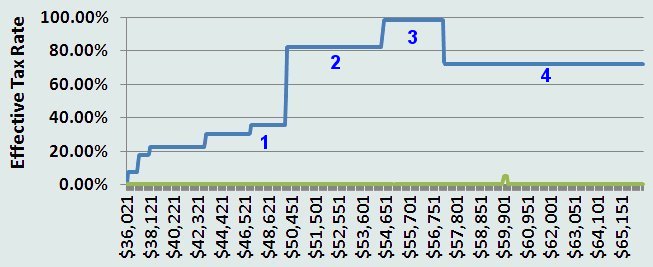
Line 1 represents the situation where your earned income is less than $14,160. It assumes that you are in the 85% surcharge bracket and the 15% tax bracket. Your taxes due are $27.75 on each $100 of earning. When you also include OASDI and Medicare, your after tax income is $64.60.
Line 2, your earned income crosses over the $14,160 limit. Your benefit is now reduced by $50 for each $100 you earn. Since this also reduces your taxability basis, your taxes due are also reduced to $24.56. But, since your income was also reduced by $50 your after tax, after OASDI and Medicare income is only $17.79.
Line 3 crosses into the 25% federal tax bracket. You've hit the wall! Your taxes due jumps to $40.94, so when you include the reduction in Social Security, OASDI and Medicare, your income is only $1.41 for each $100 of additional earnings. As mentioned before, if you include state and local taxes, your total tax rate is over 100% and you are literally paying the government for the privilege of working!
Line 4, you have now scaled the wall; you have reached the maximum taxation of your Social Security Benefit. In fact, since your Benefit is being reduced $50 for each $100 you earn, your maximum taxable social security is also being reduced by $42.50. This greatly reduces your taxes due, but you are still paying the $50 benefit reduction plus OASDI and Medicare, so your after tax earning is only $27.98 for each $100 of earnings.
What To Do
The most important thing is to be aware of "The Hump" and "The Wall", and know where your income level will be in relation to them.
Before Retirement
The Social Security Administration starts sending you statement at the age of 50. This statement will tell you your expected benefit at full retirement age, age 62, and age 70. If you have a pension, check to find out the expected pension amount at the age you wish to retire. Finally, look at all of your 401K and IRA statements. Try to estimate the total amount that you will have in these accounts at your expected retirement age. The government will force you to start making withdraws from your retirement account when you reach age 70. Determine how much you plan to withdraw each year and make sure it is at least the governmentís minimum.
Use all of these numbers to create an estimated tax return and see how close you are to the 25% tax bracket. Turbo tax has an excellent on-line tax estimator called Tax Caster. If you find yourself close or within the 25% bracket, consider opening a savings account outside of your IRA. The money you withdraw from a regular savings or brokerage account does not count toward the basis calculation.
- Wait till age 59.5 and start making withdraws to reduce the totals in these accounts. You will pay the 25% tax rate now instead of 46.25% during retirement.
- Ask your pension provider if you can take a portion of your pension as a lump sum.
During Retirement
The most important thing during retirement is to do your taxes in early December. Limit your withdraws for the rest of the year so you donít enter The Hump. If you are a few thousand dollars away from The Hump, consider making an extra withdraw at the 27.75% (15% of 185%) level this year just in case you need extra money next year.
Letís say you are the individual in the previous chart and you want to take a vacation that will cost you an extra $7,500. You will have to withdraw most if not all of the $15,700 that is in The Hump to get the money. But now you are over The Hump. Even at the average state tax rate you only have to withdraw $10,777 to get another $7,500 in cash. That is a savings of almost $5,000, so consider making a large withdraw and place that extra cash in a savings account.
What if you were planning that trip for February or March and you were $6,000 under The Hump. You could take half of the money out in December and the other half out in January and never reach The Hump.
A final word
The most disturbing thing about this page is that it is not talking about "The Rich" as the government keeps referring to them, those making $250,000 or more. The examples are not even about what most of us refer to as rich, those with "Six Figure Incomes". No, this page talks about people who make $65,000, $75,000 and $80,000 a year.
Bottom line is that there are more people with those income levels, so they are a better source of income for the government. They talk tough about the rich but target the middle class.

